Subway Surfers
 City swaps the World Tour for a permanent map: how to redesign the progression and economy of your endless runner
Team at AiToolsForAppsWritten with AI assistance15 min readIn summary
- SYBO announced Subway Surfers City on January 15, 2026, and launched it on February 26, 2026, replacing the rotating World Tour —which changed locations every three to four weeks— with a permanent city featuring four unlockable districts: The Docks, Southline, Sunrise Blvd, and Delorean Park (SYBO press release, Wikipedia).
- The change is not aesthetic: moving from a rotating novelty to a fixed map forces to sustain retention with long-term progression, not with new scenarios. This translates to redesigning the unlock ladder and the difficulty curve.
- Difficulty has a physical ceiling: the average simple visual reaction time measured in the lab is 231–238 ms uncorrected and ~213–220 ms corrected for hardware latency (Frontiers in Human Neuroscience, 2015). With a screen and touch involved, ~250 ms is the practical floor of the reaction window.
- The economy shifts to the hybrid model because that's where the money is: hybrid-casual was the only casual segment that grew in in-app purchases, +20% to $4.2 billion in 2025, and +23% to $2.4 billion in the first half of 2026 (Casual Games Trends 2026).
- Rewarded video is the central lever: eCPM of ~15 $ in the U.S. in 2026 compared to $12–13 for interstitials and ~0.50 $ for banners, and those who watch it have about 6 times more likelihood to purchase (Helpshift).
If you are developing an endless runner and are looking at what SYBO did to copy the part that works, this article is for you. The AI tools of Subway Surfers, the miniapp of AiToolsForApps for those who create, sell, or compete in the genre, exist just for that less glamorous part of the job: putting numbers to the economy, difficulty, and patterns of an endless runner before spending a month of art on a district that no one will finish.
What exactly changed in Subway Surfers City
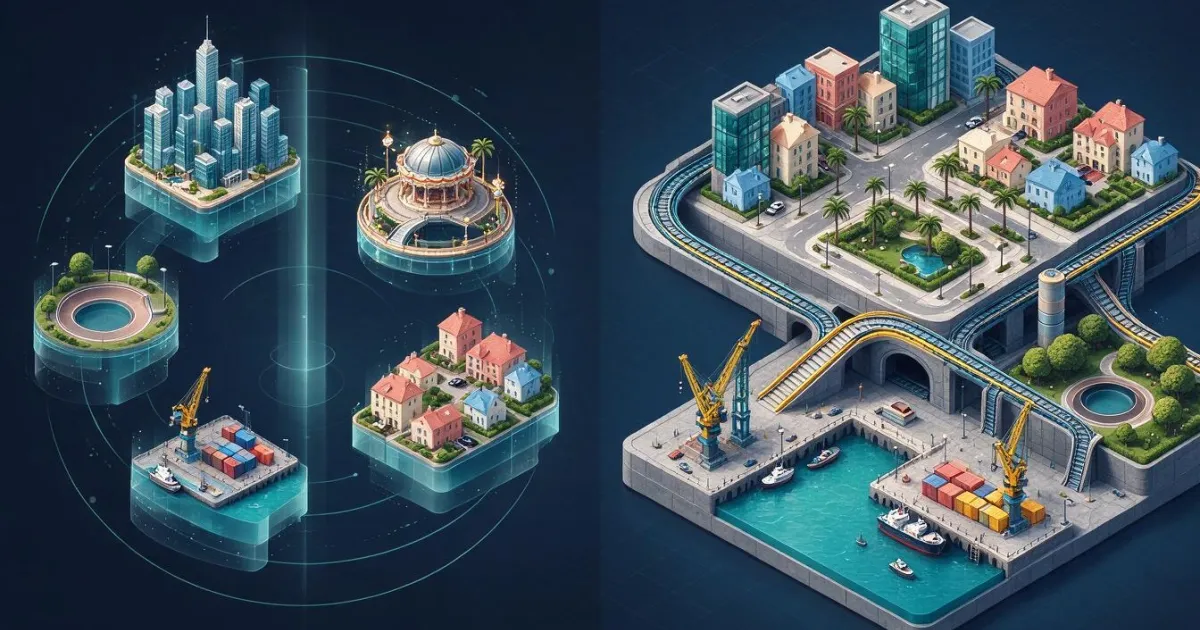
Subway Surfers City abandoned the rotating World Tour for a fixed map: a single city, Subway City, divided into four unlockable districts —The Docks, Southline, Sunrise Blvd, and Delorean Park— that SYBO will expand with new neighborhoods by seasons. The game was announced on January 15, 2026, and launched on February 26, 2026, on iOS and Android, free with in-app purchases.
The original, co-developed by Kiloo and SYBO and published on May 24, 2012, relied for almost 14 years on the opposite: a new scenario every three weeks (four on holidays), according to the historical game sheet. That cycle gave it over 4.5 billion total downloads, the figure that SYBO stated in its own announcement.
What the sequel brings, according to the launch coverage:
- Three modes: Classic Endless (infinite record run), City Tour (progression through levels and missions), and Events (finite rotating challenges).
- New mechanics: a stomp to discover hidden advantages and a gum shield that enhances jumping and survival.
- Verticality: districts with ramps, elevated surfaces, and height reading, not just three flat lanes.
- Offline play, with limited features if there is no internet, according to the game sheet on TapTap.
- Seasons that add neighborhoods, characters, outfits, and hoverboards.
Why a permanent map changes the design problem
A rotating World Tour buys retention with novelty: every three weeks there is a new reason to return, and the cost is in art production. A permanent map buys retention with progression: the reason to return has to be within the system, and the cost shifts to economy design.
| Dimension | Rotating World Tour | Permanent map with seasons |
|---|---|---|
| Return engine | New scenario every 3-4 weeks | Pending unlocks and missions |
| Dominant cost | Recurring art production | Economy design and balancing |
| Player horizon | Days (until the next rotation) | Weeks or months (until the last district) |
| Main risk | Novelty fatigue, high fixed cost | Coin wall or free progression |
| What to measure | Impact per rotation | Runs and hours per unlock |
| What happens if you get it wrong | You lose a cycle | You lose the entire cohort |
The operative phrase is this: in a fixed map, if the player sees the last unlock too far away, they leave; and if they see it too close, they leave as well. That distance is measured in runs and hours, not in "it feels good".
How to calculate a ladder of unlocks today (in games and hours)
The ladder of unlocks is calculated backwards: it does not start from the price of the hoverboard, it starts from how many coins the player earns per real minute of play. With the average game duration and the average coins per game, you have the income rate; dividing each price in the catalog by that rate gives the cost in games, and multiplying by the duration gives the cost in hours.
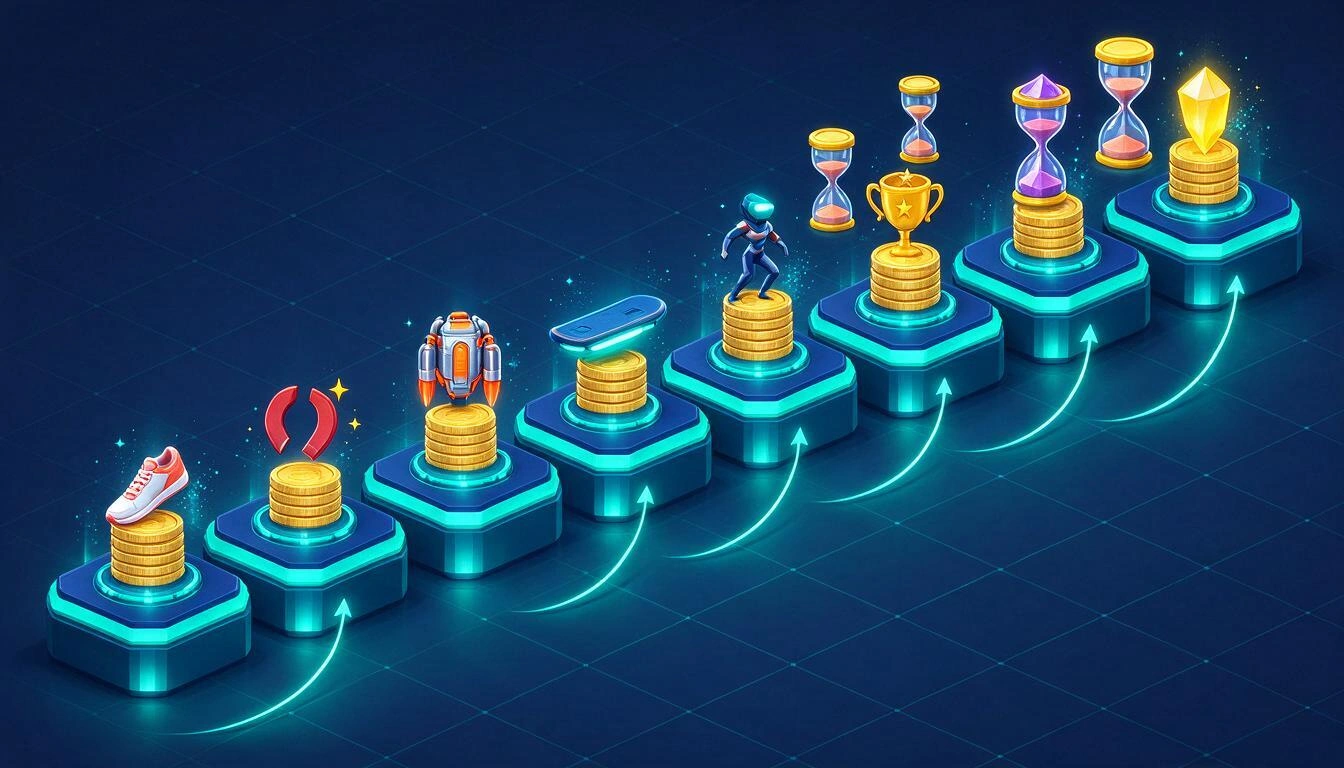
Own calculation example —not a data from SYBO— with an average game of 70 seconds and 130 coins per game (1.86 coins per second):
| Unlock | Price | Games | Hours | Accumulated Hours |
|---|---|---|---|---|
| Basic power-up | 500 | 3.8 | 0.08 | 0.08 |
| Coin magnet | 1,200 | 9.2 | 0.18 | 0.26 |
| Second character | 2,500 | 19.2 | 0.37 | 0.63 |
| Medium hoverboard | 5,000 | 38.5 | 0.75 | 1.38 |
| Premium hoverboard | 10,000 | 76.9 | 1.50 | 2.88 |
| Legendary character | 20,000 | 153.8 | 2.99 | 5.87 |
| Complete catalog | 39,200 | 301.5 | 5.87 | — |
Six hours to empty the launch catalog is little for a map that aims to last seasons, and there lies the typical indie flaw: it calculates the price by feeling, the player exhausts it in a week and then there’s nothing to chase. The adjustment is not to raise all prices by 20%, it is to choose the shape of the price curve:
- Linear: each step costs a bit more. Predictable, but the final stretch becomes flat and boring.
- Logarithmic: fast progress at first, slow at the end. It fits best with short onboarding and long retention.
- Segmented: price blocks with marked jumps, useful if the unlocks are tied to districts.
With a permanent map, the first unlock should drop in the first session —retention benchmarks do not forgive: the published D1 reference for casual hovers around 40% and D7 drops to ~10%, according to the 2026 hyper-casual statistics compilation with data from Sensor Tower, Adjust, GameAnalytics, and AppMagic— and the last should be far away, but visible.
Why the difficulty curve cannot drop below ~250 ms of reaction window
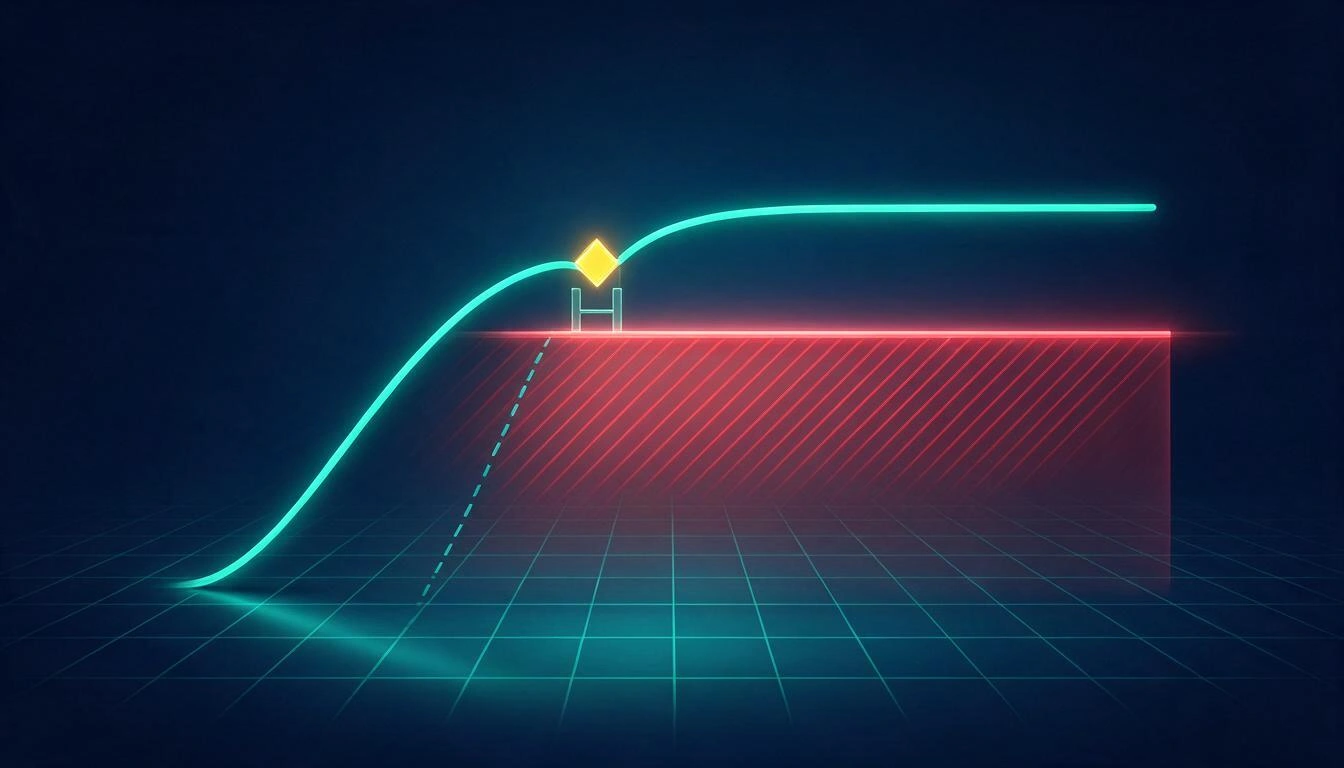
Because below that the game stops being difficult and becomes impossible. The reaction window is the time between when an obstacle enters the player’s field of vision and the moment when it is too late to dodge it: it is calculated by dividing the distance of vision by the speed of the runner. If that window falls below human reaction time, the player does not fail due to clumsiness, they fail because it is biologically impossible to hit.
Lab numbers: in two large experiments, the average simple visual reaction latencies were 231 ms and 238 ms, and dropped to ~213–220 ms when correcting for a measured hardware delay of 17.8 ms; aging adds about 0.5 ms per year, and the detection time of the stimulus does not change with age —what slows down is the motor response— according to the study Factors influencing the latency of simple reaction time published in Frontiers in Human Neuroscience in 2015.
That 213-238 ms is the floor in laboratory conditions, with the finger already resting on the button. On a mobile, you have to add latency from the touchscreen, rendering, and the animation itself, plus the player is not waiting for a single known stimulus but deciding between jumping, sliding, or changing lanes. Hence, ~250 ms is the practical floor that should be treated as a wall, not as a target.
The table you should have before touching the speed
With a useful distance of vision of 12 units (what the player sees in front of the character), the reaction window according to speed is as follows:
| Runner Speed | Reaction Window | Design Verdict |
|---|---|---|
| 9 u/s (start) | 1,333 ms | Loose: teaches mechanics |
| 15 u/s | 800 ms | Comfortable |
| 22 u/s | 545 ms | Demanding but healthy |
| 28 u/s | 429 ms | Tense: only with clean patterns |
| 34 u/s | 353 ms | At the limit of the average player |
| 48 u/s | 250 ms | Human floor: wall, not challenge |
Two practical readings. The first: stretching the curve is not raising the maximum speed, it is delaying when you reach it. If your cap is 34 u/s, the job of a permanent map is for the player to take hours to reach it, not minutes. The second: if the window is too short, there are two levers before touching the speed —increase the distance of vision (camera further back, less occlusion, telegraphed obstacles) and clean the patterns so that they do not require two chained decisions in the same window.
That’s where the verticality of Subway Surfers City becomes interesting and dangerous at the same time: ramps and elevated surfaces add one more axis of decision without adding time. Each vertical layer consumes budget from the same 353 ms window.
What monetization model fits a long-progression runner
The hybrid model, without a doubt, and for a market reason: it is the only corner of casual where in-app purchases continue to rise. Hybrid-casual grew 20% to $4.2 billion in IAP by 2025 and another 23% to $2.4 billion in the first half of 2026, with the top ten titles between +67% and +100% year-on-year, while the overall mobile IAP market barely rose by 1.3% to $81.75 billion, according to the casual trends report for 2026.
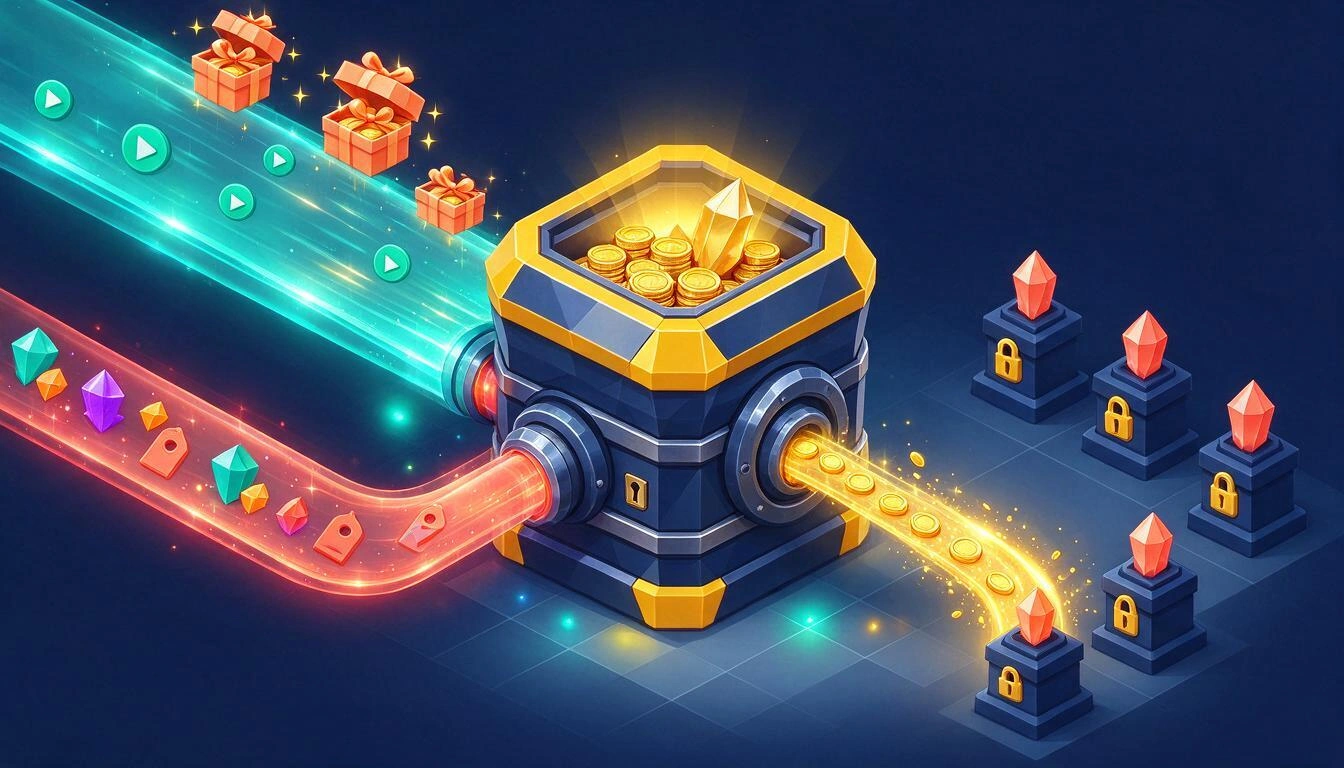
And it is also where the retention that a permanent map needs is found: hybrid-casual reports D7 of 15-22% compared to 8-12% for pure hyper-casual, with an LTV 5 to 20 times higher, according to the hybrid-casual economy analysis published in August 2026. The average D7 retention for casual overall was 14.9% in December 2025.
Rewarded video is the engine, not the complement
| Format | eCPM (US, 2026) | Role in a runner |
|---|---|---|
| Rewarded video | ~$15 (cited range of $10-50) | Continue after dying, double coins, daily chest |
| Interstitial | $12-13 | Between games, with frequency brake |
| Banner | ~$0.50 | Residual, annoys more than it pays |
Sources: eCPM by format and range and effect of rewarded video, which also estimates the improvement in advertising revenue at 20-40% and notes that those who watch rewarded ads are ~6 times more likely to buy.
The latter is the design key: rewarded does not compete with the store, it feeds it. In practice, for a permanent map runner:
- Tie rewarded to the unlock ladder, not to starting advantages. Doubling coins at the end of the run accelerates the next unlock and makes the price tangible.
- Let rewarded cut hours, not eliminate them. If with ads the catalog drops from 6 to 1 hour, you’ve erased the progression you just built.
- Sell time and expression, not power. User reports on the launch of Subway Surfers City highlight that it is not perceived as pay-to-win, while also complaining about ad frequency: that is exactly the razor's edge.
- Look at the distribution of your subgenre. In the cited analysis, sports/racing has 71% IAP and 29% ads, compared to 59/41 in lifestyle/puzzle. A runner with a long catalog of characters and hoverboards resembles the former more.
The acquisition context: that’s why progression matters so much
Global downloads of mobile games fell 7.2% in 2025 to 50.4 billion, and another 12% in the first half of 2026 to 24 billion, while playtime remained flat at 221 billion hours. With a benchmark CPI of $0.30-0.50 for hyper-casual, each installation that leaves in the first session is burned money. The permanent map is, read coldly, a bet to better monetize fewer people.
Checklist: how to redesign your endless runner from rotational to permanent
If you are going to make the same transition as SYBO, order matters: first the economy, then the difficulty, then the art. Remaking the art of a district is expensive; remaking a spreadsheet is not.
- Measure your real coin rate per second with telemetry, not designer estimates.
- Price the entire catalog in hours, not in coins, and ensure that the total covers the seasonal horizon you promise.
- Place the first unlock within the first session and the last outside the first week.
- Choose the shape of the price curve (logarithmic, linear, or tiered) explicitly and document it.
- Audit the reaction window at each speed tier with your real sight distance; mark in red everything below 250 ms.
- Verify that each obstacle pattern has at least one valid path and, if you want to reward skill, how many coins are reachable on that line.
- Fit the rewarded as an accelerator of the ladder, with a ceiling on how many hours it can cut.
- Export the numbers to the engine (Unity, Godot) so that design and code do not argue over two different tables.
Those eight steps are literally the work that the AI tools of Subway Surfers automate at AiToolsForApps: an economy calculator that returns sessions, days, and hours per unlock with four price curves; a difficulty curve audit that alerts when the window approaches the floor of 250 ms; an obstacle pattern checker that verifies that a path exists; a design document generator; and a store listing writer with the character limits of Google Play and App Store. What comes out can be exported to JSON, CSV, Unity C#, Godot GDScript, and Markdown.
Frequently Asked Questions
When did Subway Surfers City come out and how does it differ from the original Subway Surfers?
It was announced on January 15, 2026, and released on February 26, 2026, on iOS and Android. The main difference is that the original changed its setting every three or four weeks with the World Tour, while City takes place in a permanent city with four unlockable districts (The Docks, Southline, Sunrise Blvd, and Delorean Park) that can be expanded by seasons, and adds three modes: Classic Endless, City Tour, and Events.
How many coins should a hoverboard cost in my endless runner?
There is no universal figure: it depends on your coins per second. The method is to measure the average game duration and average coins per game, convert each price to games and hours, and ensure that the complete catalog covers the retention horizon you are looking for. With 70 seconds and 130 coins per game, a hoverboard costing 5,000 coins takes about 38 games and three-quarters of an hour.
What is the maximum speed at which the character can run without making the game unfair?
The speed that keeps the reaction window above about 250 ms. That window is the line of sight divided by the speed: with 12 units of vision, 34 u/s leaves 353 ms and 48 u/s leaves exactly 250 ms, the human floor. The average latencies for simple visual reaction measured in the lab are between 213 and 238 ms, so below 250 ms on a mobile the player can no longer react.
Is it better to monetize an endless runner with ads or in-app purchases?
With both, in a hybrid model. The hybrid-casual was the only casual segment that grew in in-app purchases, by 20% to $4.2 billion in 2025 and another 23% in the first half of 2026, and reports a D7 retention of 15-22% compared to 8-12% of pure hyper-casual. Within the advertising part, rewarded video is the one that pays: ~ $15 eCPM in the U.S. in 2026 compared to $12-13 for interstitials.
What difficulty curve works best in a permanent map game?
A curve that rises quickly at first and then flattens out, logarithmic in nature, because a permanent map needs short onboarding and a distant ceiling. The linear ramp is the usual trap: it advances at a constant pace and ends up crossing the reaction floor before the player has completed progression.
How much gameplay should the complete unlocks catalog cost?
Enough to cover the season you announce. If you promise seasonal content and the catalog empties in six hours, the cohort leaves before the first update. A useful check is to convert the entire catalog to hours and compare it with the actual interval between your updates.
Does rewarded video help accelerate unlocks without breaking the economy?
Yes, as long as you set a ceiling. It is advisable to tie it to the ladder —doubling coins at the end of the game, daily chest— and decide in advance how many hours at most it can cut from the catalog. Additionally, it is profitable in itself: according to Helpshift, it increases advertising revenue by 20-40% and those who see it are about 6 times more likely to make a purchase.
What You Get
SYBO's move with Subway Surfers City is a clear signal for the entire genre: the rotating novelty has become expensive to maintain, and the replacement is long-term progression. But that progression only works if it is calculated —hours per unlock, reaction window per speed segment, ceiling of the rewarded video— and not guessed. The AI tools of Subway Surfers at AiToolsForApps turn exactly that into numbers you can discuss with your team and export to Unity or Godot: the economy, difficulty, and patterns calculator for endless runners is used without registration, and what you generate can be claimed later in your account.
Subway Surfers is owned by SYBO Games and Kiloo. This tool is independent and has no affiliation, sponsorship, or endorsement from SYBO Games or Kiloo. The market data cited comes from the sources linked in the text; the numerical examples of the unlock ladder and reaction window are illustrative calculations.
Put numbers to your endless runner before spending a month on art: calculate the hours each unlock costs, audit the reaction window of your difficulty curve, and ensure that each obstacle pattern has a clear path. Try Subway Surfers' AI tools for free, no registration required.
Put numbers to your endless runner before spending a month on art: calculate the hours each unlock costs, audit the reaction window of your difficulty curve, and ensure that each obstacle pattern has a clear path. Try Subway Surfers' AI tools for free, no registration required.Keep reading
View all articles →
63% of your runner's revenue comes on day 1: how to design the first 90 seconds and the first unlockable
Broken Geode in Geometry Dash 2.2091: which mods are not working and how to keep creating

DLS 27 in December 2026: what is confirmed, what is not, and what happens to your club, your squad and your kits when you update